There is a wide range of statistical software and programming languages to chose from. SAS, SPSS, R, and Python are the most used. SAS and SPSS are proprietary while R and Python are free programming languages.
Because R and Python are free and open source, they are growing fast. These free programming languages can be used without buying any license. There is a large community around them, and programmers are continually building new libraries or improving existing ones. Because they do not have a user interface, they have a steep learning curve for those that do not have some programming experience.
Python and R are programming language: they can be used to express ideas or workflows. Also, they do not provide a graphical user interface.
Kaggle, the largest online community of data scientist, use Python and R.
Commercial software has official support from its vendors. While R and Python do not have official support, they have a large community around them and it’s easy to find an answer in sites like StackOverflow. Also, there are companies that provide commercial support for R and Python.
SAS
Used a lot in Medical Sciences but also in a wide range of industries.
SAS was developed at the North Carolina State University. It was born as a tool to analyze large datasets of agricultural data. SAS stands for Statistical Analysis System. The company SAS was founded in 1976, as the demand for the software increased.
It’s expensive and it’s praised because it can handle very large datasets. The job market for SAS is large, mostly in Pharma, Government and Banking.
SAS EM is a tool to create and deploy predictive models but looks somehow abandoned and odd when viewed by modern programmers coming from Python or other languages.
Why do large companies do not use Python or R?
- SAS is used a lot in healthcare, banking and insurance. A lot of code is already written in SAS. Most of this code is sunk cost and companies do not want to rewrite code in favor of Python or R.
- Management is reluctant to switch to open source tools, because there is risk involved in translating code, no matter if the new code will be written using commercial or open source tools. Management doesn’t want to be blamed if something goes wrong.
- Large companies like to have official support. Some IT departments like to blame someone if something goes wrong.
- Regulators prefer SAS over Python and R.
- SAS sells packages designed for specific industries. These packages run typical statistical analysis performed on those industries. If a company doesn’t have a statistician on staff, SAS can be a good choice.
SAS uses simple scripts to invoke its procedures. It has a steep learning curve when compared with SPSS and complex command structure.
SPSS
SPSS is used a lot in Social Sciences, like economics and psychology. It is popular in Universities and in the academy. Is relatively easy to use and popular among practitioners. It has a graphical user interface. It is strong in analyzing survey datasets.
SPSS stands for Statistical Package for Social Sciences. SPSS was developed in 1968 at the University of Stanford. SPSS was bought by IBM in 2009.
SPSS has built it most popular statistical tests, like ANOVA and linear regressions. So it’s very easy and fast to use if you want to run a common statistical test. The output is detailed and the plots are visually appealing.
If you manage complex datasets on a daily basis, you should use another tool, like SAS. Also, SPSS in slow in handling large datasets.
Python
Of this list, Python is the only programming language not created specifically for statistics. Python was developed by a guy who wanted to create an easy to learn a general-purpose programming language.
Because it’s easy to learn and free, Python gained a lot of adoption in several fields. Also, programmers created a lot of libraries for Python, including some that can be used for statistics, like Pandas, Numpy and Matplotlib. Python statistical features are excellent in prediction.
Python can handle large datasets with ease. Also, Python is used in production environments.
Because it has very good libraries for image processing, data mining and machine learning, Python is growing fast and outperforms the other tools in these fields.
For some specific statistical analyses, like explanatory models, R can outperform Python.
R
It’s a programming language that was created specifically for statistics.
The first version of R was released in 2000 at the University of Auckland. Because R was created in the academic, it’s excellent in prediction and explanatory side of statistics.
It’s free and has a good and rich library ecosystem. For example, ggplot2 is praised for its graphics and considered by a lot of people better and simpler than Python graphical libraries.
R can import datasets from SAS, SPSS, and others. For large datasets, Python is better. R can also connect to other data sources, like SQL and NoSQL datasets.
What is the most popular statistical software?
The job market for R is growing fast, but it is still lagging behind SAS in some industries. In the following plot, we can see the results of a pool made by ButchWorks (a data scientists recruiting company) where they just asked: “Which do you prefer to use – SAS, R, or Python?”
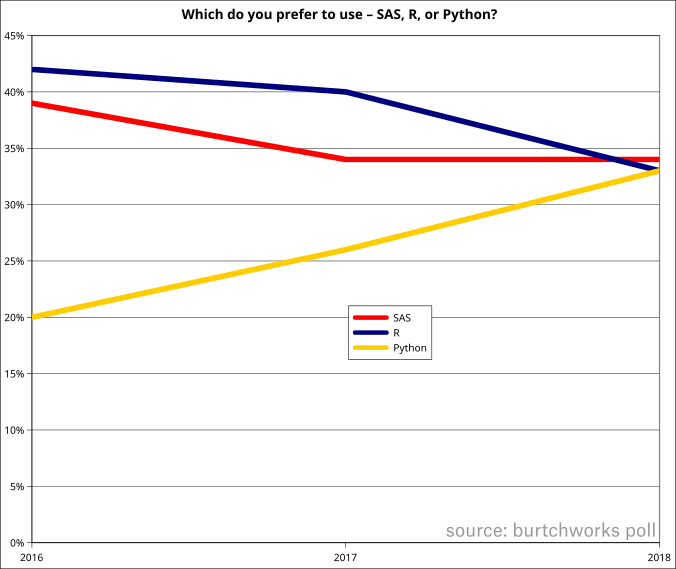
As we can see, Python is growing fast and SAS is falling behind R and Python. Anyway, this is a general poll, probably SAS is still above Python and R between seniors and in the large corporate world, and R outperforms Python and SAS in the academic environment. Anyway, it is a fact that the capabilities of Python and R are growing at an extraordinary pace.
Nowadays, every data scientist is required to know at least 2 tools mentioned in this article, plus SQL.