A demand function describes the mathematical relationship between the quantity demanded and one or more determinants of the demand, as the price of the good or service, the price of complementary and substitute goods, disposable income, etc.
Qdi = f(price i,price j, price k, I,…)
Since the most important determinant of the demand for a good is the price of the good, the demand is usually represented by:
Qdi = f(Pi)
A simple demand function is the linear demand function:
Qdi = A - bPi
The Law of Demand
This simple function illustrated the Law of Demand. The law of demand is a principle that states that there is an inverse relationship between price and quantity demanded. When the price of a product increases, the demand for that product will fall. We can see this in the negative slope of the demand curve.
This is represented by the negative slope of the demand function.
More than one determinant of the demand
If we include additional determinants, besides the price, the demand function can be visually represented by an n dimension plot.
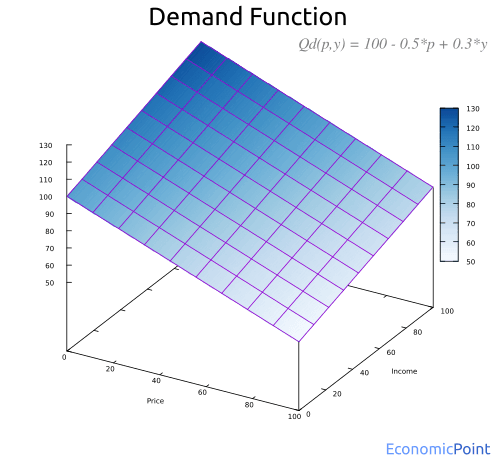
For instance, if we include the price and disposable income, we can visualize the following function:
Qd(p,y) = 100 - 0.5*p + 0.3*y
Where p is the price of the good and y is the disposable income.
And in the following visual representation of the function, we can see how the demand decreases when the price increases, and how the demand increases when the disposable income increases:
Changes in the Demand
A change in any determinant of the demand function will change the quality demanded. If there is a change in the price of the good, there is a movement along the demand curve. If there is a change in any determinant other than the price, such as disposable income, there is a shift in the demand curve. The demand function can change or not, depending on if the determinant that changed is included in the function, or was taken as an external factor.
For example, if the demand function is a simple linear function with only the price as input: Qd = 1000 - 0.5P, then, if the disposable income increases, there will be a shift in the demand curve and a change in the demand function. The new demand function can be Qd = 1100 - 0.5P.
But if the demand function has two inputs, the price and the disposable income, like Qd = 1000 - 0.5P + 0.1Y, then a change in the disposable income will not change the demand function. If we plot this function, we will obtain a 3-dimensional plot, like the shown above. The demand is represented by a surface and not a line. A change in the price or the disposable income means that the demands move from one point to another along the same surface.
Now, if we are still analyzing the same 3-dimensional demand function and there is a change in the price of a complementary good, the whole surface representing the demand function will change. There is a shift in the demand surface.
Movement along the Demand Curve - 2 dimensions
There is a movement along the demand curve when the price of the good changes. For instance, if the price of the good falls, the demand increases.

Shifts in the Demand Curve - 2 dimensions
When a determinant other than the price changes, there is a change in the demand. But the whole demand curve moves. For instance:
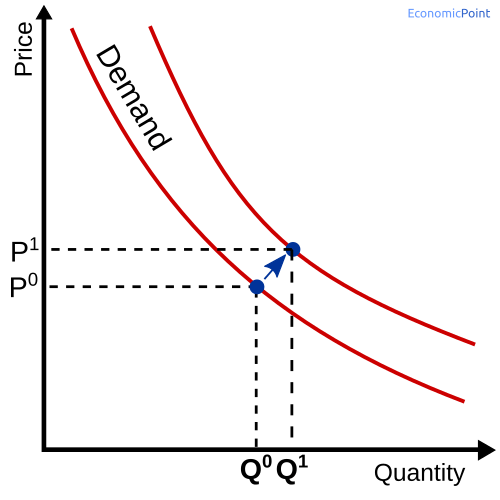
- If disposable income increases, the demand curve will shift upwards.
- If the price of a complementary good increases, the demand curve will shift downwards.
- If the price of a substitute good increases, the demand curve will shift upwards.
- Whenever there is a change in consumers’ preferences, the demand curve can shift downwards or upwards.
Demand Function for Perfect Substitute Goods
Perfect Substitute Goods are those goods that can satisfy the same necessity in exactly the same way.
The demand function for perfect substitutes can be described as follows. If the price of X is lower than the price of Y, the demand will be a function of the price of X. If the price of Y is lower than the price of X, the demand will be a function of the price of Y. The demand function is the same is both cases.
If prices are equal, the total quantity demanded is a function of the price. There is a mix of X and Y, but the model doesn’t determine the exact amount of each good.
Then:
X = f(Px) and Y = 0 for px < py
Y = f(Px) and X = 0 for px > py
X + Y = f(Px) for px = py
Where:
X: quantity demanded of good X.
Y: quantity demanded of good X.
Px : Price of X.
Py : Price of Y.
f(Pi) : Demand function.
Figure: Demand for a Perfect Substitute Good